Do you have the
People
Processes
Platforms
to keep up with the data deluge? We do.
We are the world’s largest pure-play decision science and data analytics firm.
But We See a Larger Need
To scale and systematize better decision-making through business intelligence services.
We call it
The Art of Problem Solving System™
Because traditional methods can’t keep up with today’s pace of change.
Learn MoreMu Sigma Belief System
Uber Thought
Nature prefers the Goldilocks state of1 Flow which is a Harmony1 between Order and Entropy.


“Learning is the rate of change of Knowledge... It is more important than Knowing...Yesterday, companies were competing on Knowledge...Today, companies are competing on learning...Tomorrow, companies will compete on rate of change of Learning; we don’t yet have an english word for that!”

X2 > experts
“Most of us feel we know more than we actually do... We are like monkeys throwing darts at moving dartboards. Our hubris wants us to believe that we can throw more darts by reducing the cost per dart... This will improve our chances of hitting bullseye. Extreme experimentation is the key to innovation.”

NEW IP
(vs)
OLD IP
“The new IP is no more just intellectual property...it is Interaction Property. The new IP is open and wants to connect, as opposed to the old IP which is closed. The new IP believes that to compete well, you need to complete the ideas by linking them across entities, functions and disciplines.”

“All entities in nature, animate or inanimate, cease to exist if they are not in a state of Flow. To feel and be alive, the configurtion of a Flow System2 must evolve in such a way that provides easier access to currents that flow through it.”
- 1. harmony = appreciation for duality in pursuit of singularity
- 2. flow system = current that is flowing + design through which it flows
Management Consulting? Mathematics? Software?
Data Analytics? AI?
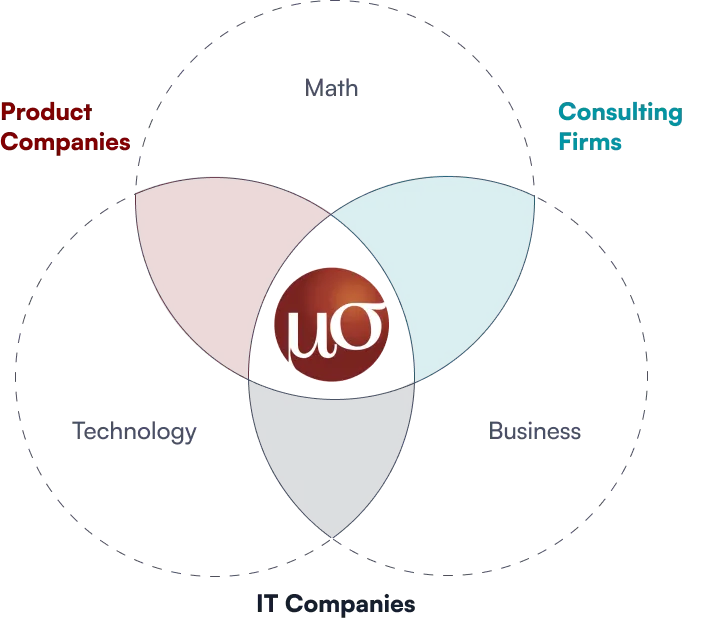
We are a Decision Sciences Company
Truth is, we’re all of the above. We are art plus science, done at scale, implemented as one.
We’ll Accelerate Your Journey From
Data To Decisions
Mu Sigma's work with clients spans all levels of the decision support ecosystem.
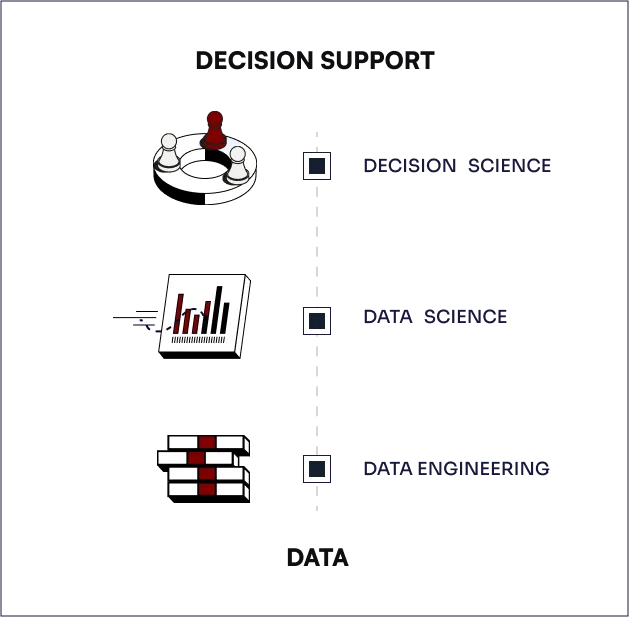
We wrap talented people in the bionics of our processes and data analytics platform, and apply them to a cross-industry client base.

- 1 Problem-Solving Platform
- 2 Tools
- 3 Process & Methodology
- 4 Decision Scientists
- 5 Cross-Industry Client Base
The firm's name is derived from the statistical terms "Mu" and "Sigma," which symbolize a probability distribution's mean and standard deviation, respectively.